Tutorial
Writing Data Stories in Markdown
This tutorial introduces Markdown editing for the NFDI4Culture Data Story Framework. Each section shows both the source and the rendered output so you can copy and adapt examples directly in your stories.
1) Core Markdown Syntax
Headings
Use # through ###### for levels 1–6.
Rendered:
H1
H2
H3
H4
H5
H6
Paragraphs, line breaks, rules
A normal paragraph. End a line with two spaces
to force a line break.
Emphasis & inline semantics
You can also use special formatting options like emphasis and inline annotation.
Source
*italic* and **bold**; also _italic_ and __bold__.

==marked/highlighted== text (pymdownx.mark).

Strikethrough with ~~deleted text~~ (pymdownx.tilde).
Subscripts like H~2~O and superscripts like x^2^ (pymdownx.tilde + caret).
Inserted text with ^^inserted^^ (pymdownx.caret).

Inline code: `print("hello")`
Language-highlighted inline code: `#!python print("hello")` (pymdownx.inlinehilite).

Smart symbols: (c) (tm) (r) 1/2 1/4 --> — ... (pymdownx.smartsymbols).
Rendered examples: italic, bold, marked, deleted, H2O, x2, inserted, print("hello"), and print("hello").
Smartsymbols → © ™ ® ½ ¼ — …
Lists
- One
- Two
- Three
Links and images
URLs are automatically linked.
Source
Standard link: NFDI4Culture
Bare URL (auto): https://nfdi4culture.de/
Repository shorthand: ISE-FIZKarlsruhe/bikidata#123

Code blocks & syntax highlighting
Use fenced code blocks with optional language, title and line numbers. Highlight specific lines via hl_lines (space-separated).
Tables & blockquotes
Source
| Column A | Column B |
|---|---|
| A1 | B1 |
| A2 | B2 |
A blockquote can span multiple lines.
Attribute Lists, Abbreviations, Footnotes
Attribute Lists
Attach classes/IDs/attributes to most elements.
Source
A lead paragraph
A paragraph with a custom class and width. {: .lead style="max-width:60ch"}
Abbreviations
Define abbreviations once and use them throughout.
Source
The site is built with HTML and CSS.
Footnotes
A sentence with a footnote.1
Block Directives
The Data Story Framework uses directive-style blocks written with /// fences.
Admonitions
Note
This is an admonition using the Blocks syntax.
Details
Show more
Additional information can be hidden by default.
Captions for figures
Use with images or diagrams to provide a semantic caption.
Source
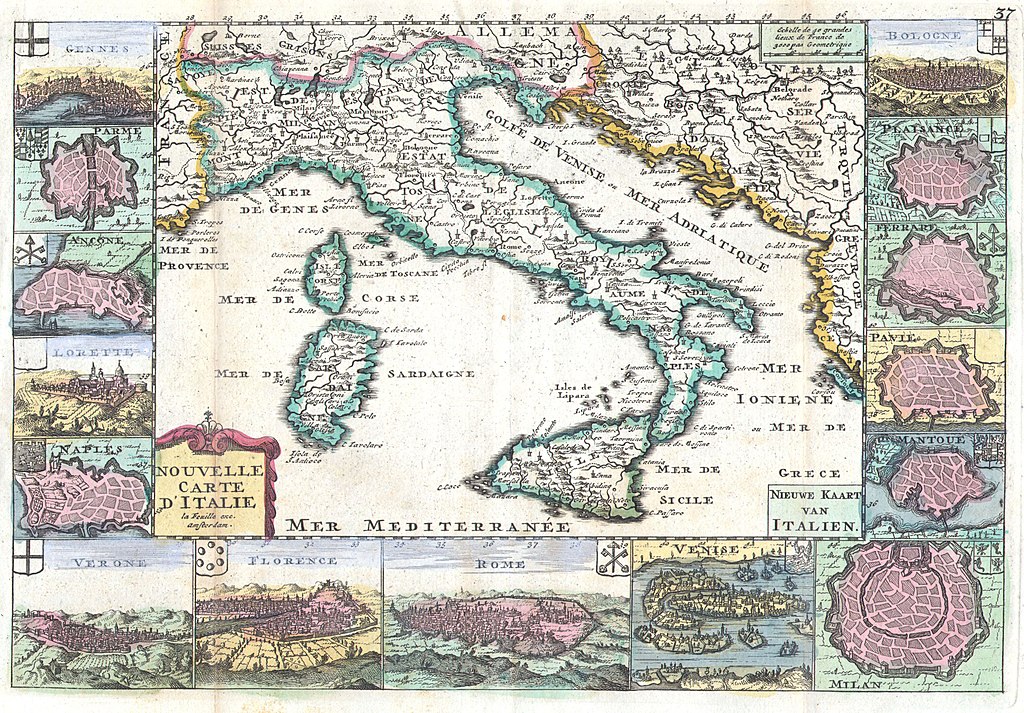
Daniel de Lafeuille, Nouvelle Carte D’Italie (1706), Public Domain
Raw HTML blocks
Inline content rendered in a custom container.
SPARQL & SHMARQL Blocks
Use a sparql fence to show a query with syntax highlighting, and a shmarql fence to execute/render a result (using your configured endpoint). You can include query text from files with pymdownx.snippets.
Display the query
sparql fence
Directly execute and render the result
shmarql fence
Syntax highlighting options
Attach attributes to code fences: linenums, title, hl_lines. Anchored line numbers help deep-link to a line.
| count-all-triples.rq | |
|---|---|
Snippets
Re-use content by including files or fragments.
If the referenced files exist, they will be inlined here at build time.
Charts with Plotly
Use the shmarql fence to render an interactive Plotly bar chart from a live SPARQL query. The header directives configure the visualisation—barchart view, type on the x‑axis, count on the y‑axis, and the y‑axis label “Instance Count”. The query returns the ten most frequent RDF classes in the graph, ordered by frequency; casting to xsd:integer ensures proper numeric handling. Adjust LIMIT or swap the axis keys to tailor the chart to your analysis.
# shmarql-view: barchart
# shmarql-x: type
# shmarql-y: count
# shmarql-label: Instance Count

PREFIX xsd: <http://www.w3.org/2001/XMLSchema#>

SELECT ?type (xsd:integer(COUNT(?subject)) AS ?count)
WHERE {
  ?subject a ?type .
}
GROUP BY ?type
ORDER BY desc(?count)
LIMIT 10
-
This is the footnote text. ↩